Contents
Key Facts
The current edition of this report analyzes available data on homelessness for 2022 and over time. Key facts and data points include:
- Homelessness has been on the rise since 2017, experiencing an overall increase of 6 percent.
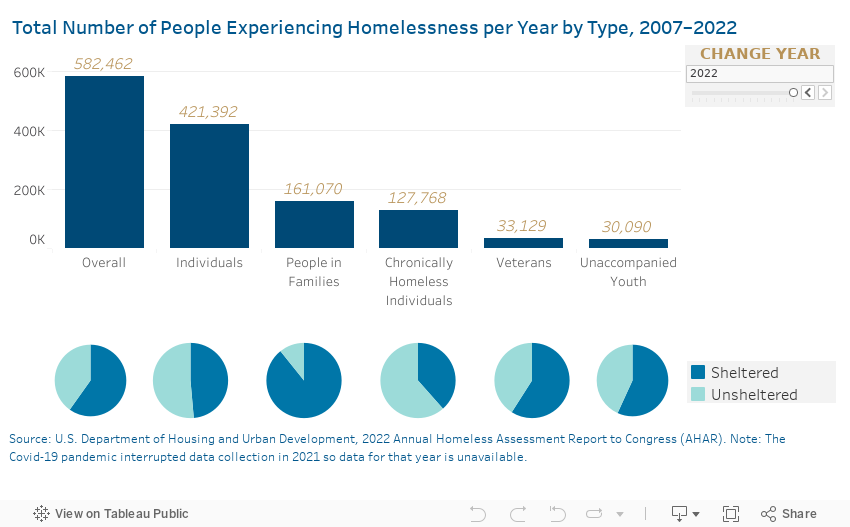
- In 2022, counts of individuals (421,392 people) and chronically homeless individuals (127,768) reached record highs in the history of data collection.
- Unsheltered rates are also trending upward, impacting most racial, ethnic, and gender subgroups.
- Homeless services systems continued to expand the availability of both temporary and permanent beds in 2022, but these resources still fall short of reaching everyone in need.
- Homelessness rose by a modest 0.3 percent from 2020 to 2022, a period marked by both pandemic-related economic disruptions and robust investments of federal resources into human services.
The State of Homelessness: 2023 Edition uses data from the U.S. Department of Housing and Urban Development (HUD) to provide an overview of the scope of homelessness in the U.S. on a given night in 2022, and illustrate emerging trends. Data in this report is pulled from HUD’s 2022 Point-in-Time (PIT) Count data, as well as Housing Inventory Count data. Each section features interactive charts to display this data, with highlights discussed in the text of this report.
Homelessness in 2022
According to the January 2022 PIT Count, 582,462 people were experiencing homelessness across America. This amounts to roughly 18 out of every 10,000 people1. The vast majority (72 percent) were individual adults, but a notable share (28 percent) were people living in families with children.
However, there is more to the story of homelessness in 2022. This section will delve deeper into questions of 1) who is experiencing homelessness, 2) where they are experiencing it, and 3) the degree to which people are living unsheltered.
Who is Experiencing Homelessness in 2022: Special Populations
For reasons rooted in practice and policy, the homeless services world focuses on specific special populations. Of people experiencing homeless:
Who is Experiencing Homelessness in 2022: By Race/Ethnicity
Available data demonstrates that race and ethnicity are key determinants2 that impact 1) who will become homeless and 2) the type and depth of rehousing barriers people will experience.
Within the 2022 PIT Count data, White people are numerically the largest racial group. They represent half (50 percent) of all people experiencing homelessness. However, issues of representation are more complicated than that data point would suggest.
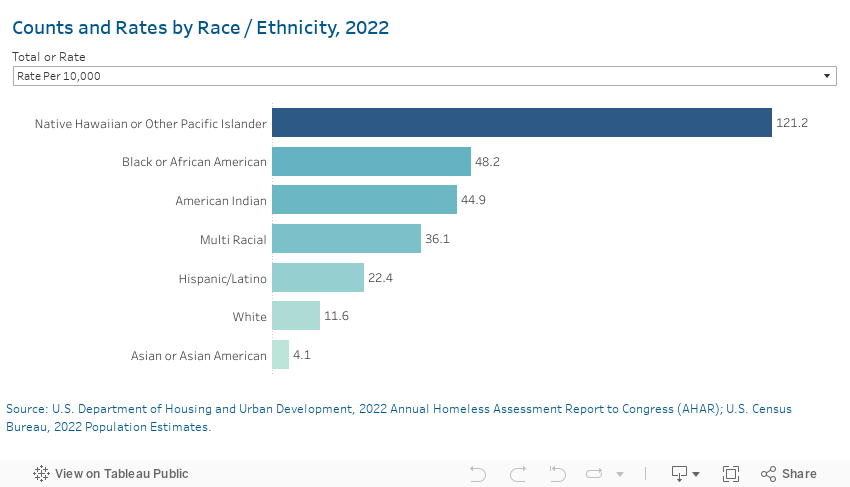
Most groups of color have higher rates of homelessness than their White counterparts—and, in some cases, far higher. Within the White group, 11 out of every 10,000 people experience homelessness. For Black people, that number is more than four times as large—48 out of every 10,000 people. Native Hawaiian or Pacific Islanders particularly stand out as having the highest rates, with 121 out of every 10,000 people experiencing homelessness.3
The racial and ethnic groups with the highest incidences of homelessness have extensive histories of experiencing oppression, including displacements from land and property and exclusions from housing opportunities. Effectively addressing homelessness will likely require invested partners to account for America’s history, and that history’s influence on current culture, policy, and practice.
Who is Experiencing Homelessness in 2022: By Gender
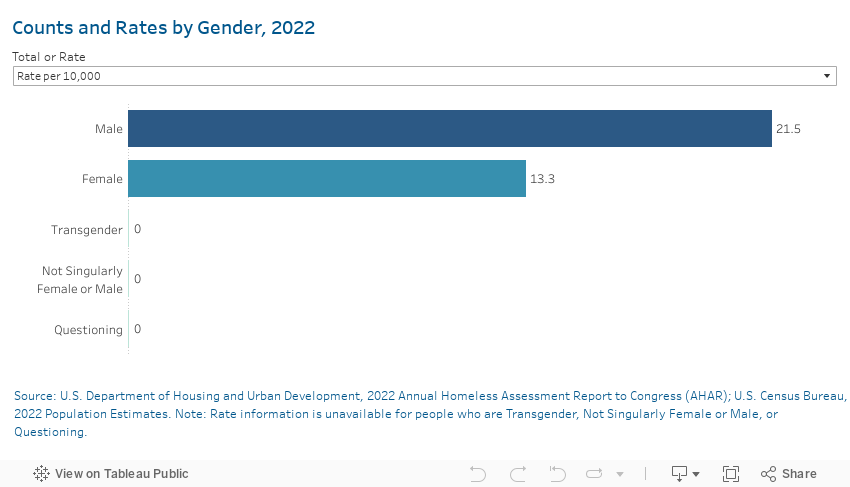
Gender also matters. Within the overall homeless population (which includes both adults and children), men, who are 68 percent of the individuals population, far outnumber women and are far more likely to experience homelessness. Serious systemic failures are occurring in relation to some of America’s men, implicating holes in the social safety net, challenges within feeder systems, and barriers to rehousing.
Meanwhile, women (both those living as individuals and in families with children) and people who identify as transgender, nonbinary (“not singularly female or male,” per HUD), and questioning are also notably represented within homelessness (see visualization below). They have unique barriers and needs that must also be addressed.
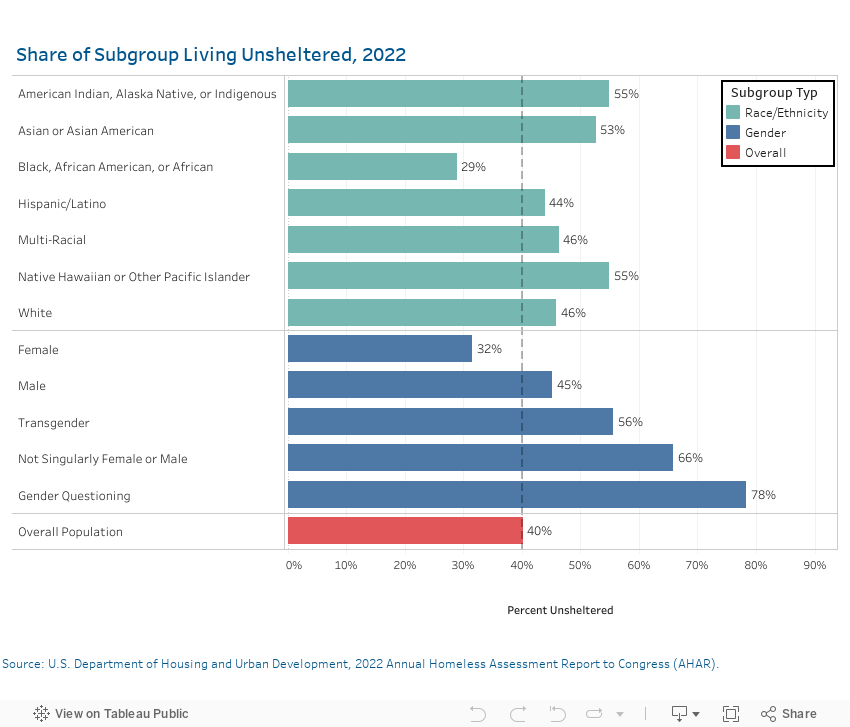
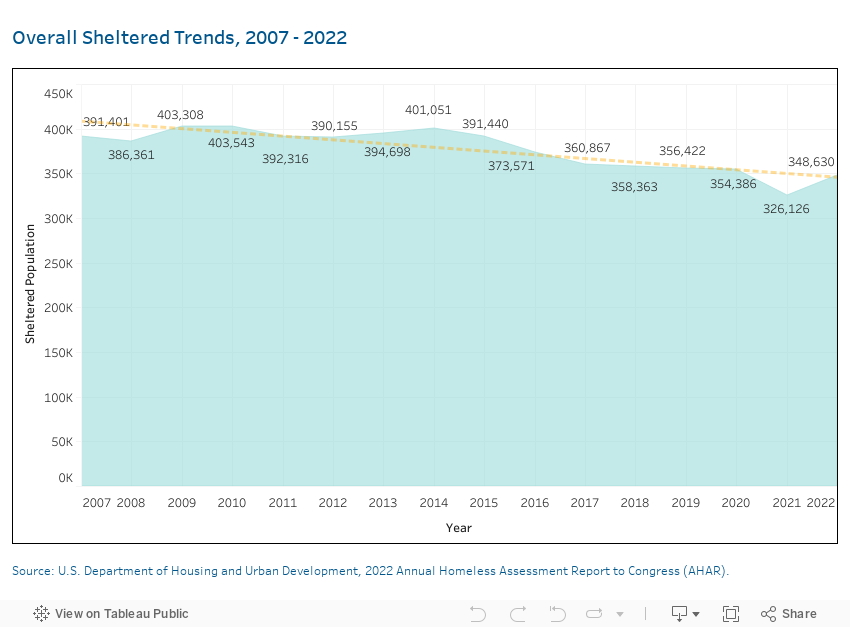
Who is Unsheltered in 2022
Throughout America, numerous dedicated workers use limited available resources to serve people experiencing homelessness. On a given night, the homeless services system provides shelter for 348,630 people. Despite these significant efforts, 40 percent of people experiencing homelessness live unsheltered, which means their primary nighttime residence is a place not suitable for human habitation (for example, a city sidewalk, vehicle, abandoned building, or park). Significantly, living unsheltered can impact a person’s health and safety.
Individuals are particularly likely to be unsheltered. The majority of the group (51 percent) are sleeping in these settings. For the subset of individuals who are chronically homeless, the status quo is particularly dire—62 percent are unsheltered. Families with children, who are often prioritized for services, are least likely to live unsheltered—11 percent live in such situations.
Race- and gender-based inequalities are readily evident in unsheltered homelessness (see visualization below). When subgroups are not accessing or utilizing shelter, it suggests they may not be equally benefitting from government investments in solutions to homelessness.
Members of the LGBTQ community accounted for in current data collection (i.e., people who identified on HUD surveys within the categories of transgender, gender questioning, or nonbinary), have particularly high rates of unsheltered homelessness. Many other populations also stand out, having levels of unsheltered homelessness that surpass those of the overall population. This includes every racial, ethnic, and gender group except women and Black people, whose levels of unsheltered homelessness are less than the overall population. The reasons for these disparities are worthy of further research and analysis.
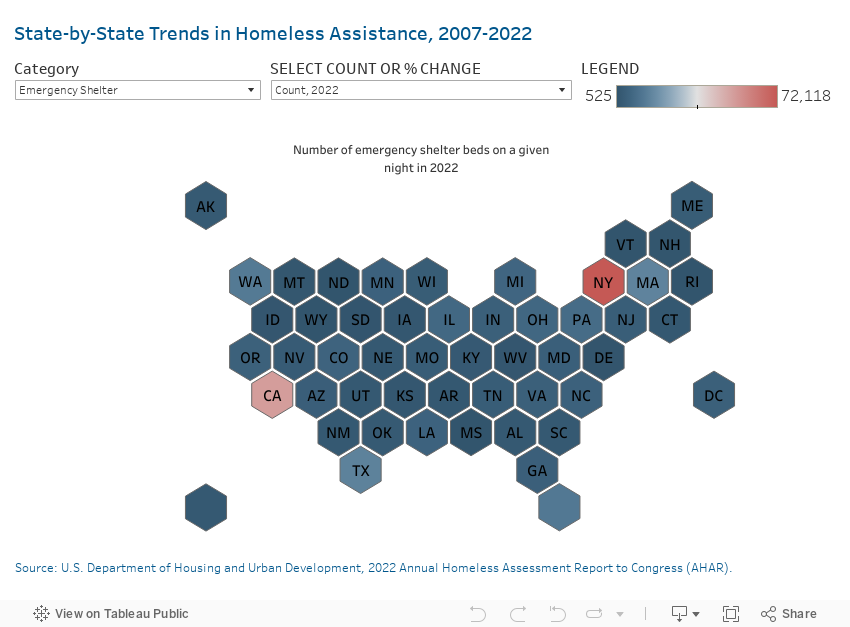
Locating Population Hot Spots in 2022
State and community stories of homelessness vary. Some are managing populations that are simply large; others have numbers that are larger than what would be expected given the size of their jurisdiction. Identifying locations with a disproportionately large homeless population is useful for at least two reasons: 1) it helps target resources to the places most in need of assistance, and 2) examining population variations across jurisdictions helps refine the field’s understanding of homelessness causes and solutions. For example, jurisdictions with smaller-than-expected homeless populations may be implementing solutions worthy of replication in other parts of the country.
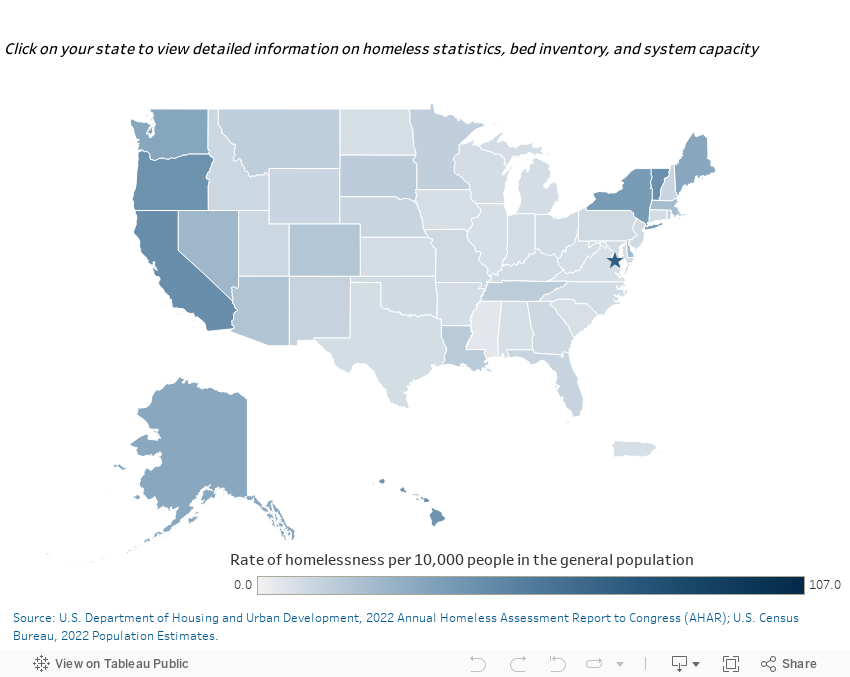
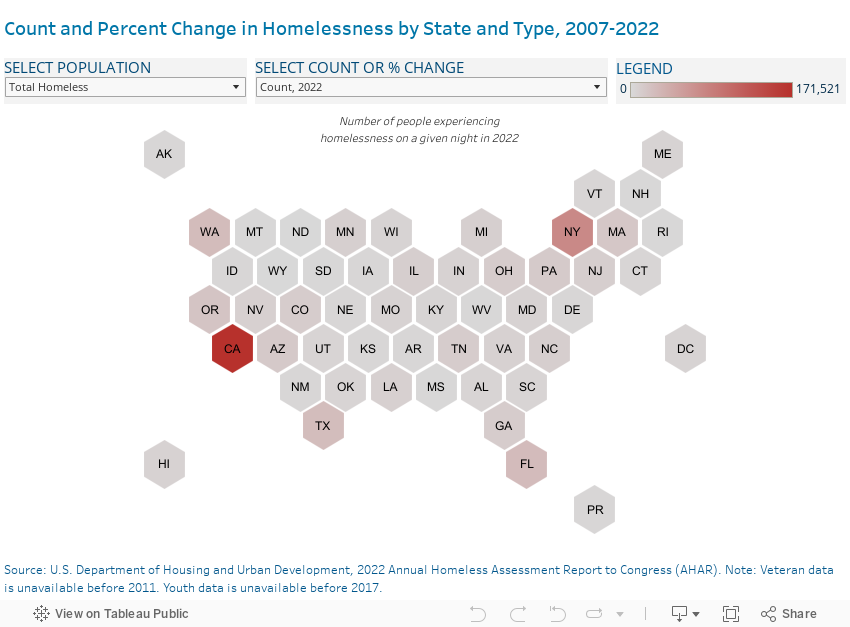
Homelessness is largely concentrated in certain areas of the country. Solving challenges in a few jurisdictions (those with the largest unhoused populations) would significantly advance the goal of ending homelessness. Just five states (California, New York, Florida, Washington, and Texas) account for 55 percent of people experiencing homelessness. And a mere 25 Continuums of Care (CoCs) account for 47 percent of all homelessness.
Many of these states and communities simply have a lot of residents and are generally populous. Thus, it is unsurprising that their subpopulations (including people experiencing homelessness) are also relatively large. To understand whether challenges exist beyond this dynamic, it is necessary to examine per capita experiences of homelessness.
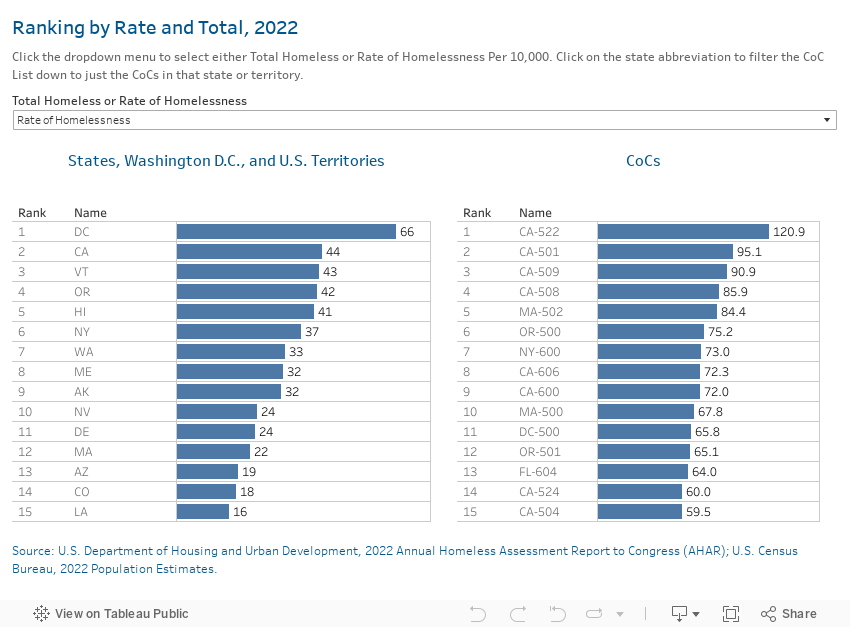
Per capita experiences of homelessness vary greatly. For example, at the state level, Mississippi represents a low rate of homelessness, with only 4 people out of every 10,000 experiencing homelessness. Californians have the highest likelihood of being unhoused, however—44 out of every 10,000 residents. Similar variation exists at the local level, with Humboldt County, California reporting the highest per capita experiences of homelessness (121 out of every 10,000 people) and the CoC serving Dearborn, Michigan having the lowest (2 out of every 10,000 people).
Several major cities with high housing costs top the list of CoCs with the highest likelihood of homelessness, including San Francisco, New York City, Los Angeles, Boston, Washington, D.C., Portland, and Seattle. Implementing solutions to the housing affordability crisis in those areas would tremendously advance the goal of ending homelessness.
While housing costs and population size play into per capita experiences of homelessness, there are likely other factors contributing to high per capita rates. Researchers, data experts, and others should continue efforts to identify and unpack them.
Homelessness Trends Over Time
Homelessness in 21st century America has largely been defined by steady but modest progress since data collection began in 2007. Between 2007 and 2016, the population of people experiencing homelessness shrank most years. However, the overall reduction was only 15 percent during that nearly decade-long period.
Prior to the COVID-19 pandemic, a new trend emerged: consistent annual increases in homelessness. And the unprecedented health crisis had the potential to further complicate matters. For people who were already unhoused, how would their health and economic security improvement efforts be impacted? And as businesses closed and unemployment rates rose, would new people seek help from shelters?
Tracking COVID-related population changes proved difficult. The pandemic disrupted data collection in 2021. By 2022, the full PIT Count resumed, and data showed that the homeless population had once again increased—but by only 0.3 percent. Given the unprecedented circumstances facing the nation, the shift could be characterized as being unexpectedly small. Federal policy likely impacted outcomes: COVID-19-related government interventions benefitted many people. Eviction moratoria and the federal Emergency Rental Assistance (ERA) program kept (and are still keeping) many people housed. Additional investments were made in homeless assistance and housing vouchers targeted to people impacted by homelessness.
Homelessness Trends: Household Types and Special Populations
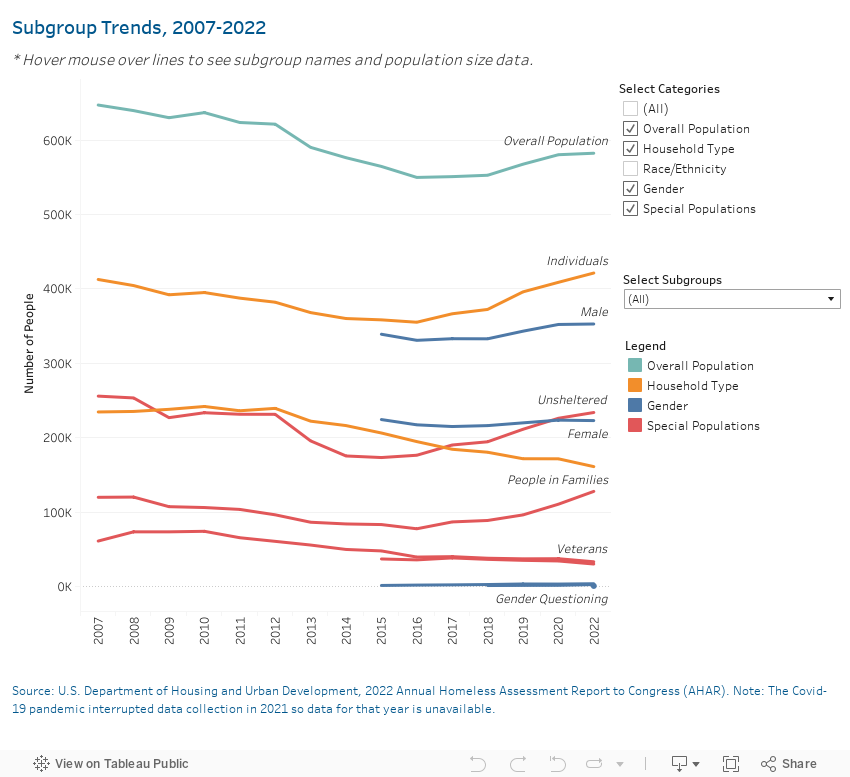
Progress in ending homelessness has been uneven across subgroups since data collection began in 2007. And although the overall homeless population increased slightly between 2020 and 2022, the same was not true for all subgroups. Some actually got smaller over that time period—1) families with children, 2) youth, and 3) veterans (see visualization below).
Due to factors such as vulnerability and history of military service, these groups are often targeted by both government and non-governmental interventions. Notably, the nation’s progress on veteran homelessness has been particularly robust. The size of the group was cut in half over a decade-long period (2010-2020), decreasing by 50 percent. A total of 83 communities and 3 states have functionally ended veteran homelessness. Veterans have been the focus of concerted strategies and efforts (including governmental investments) that have been successful. Similar attention and resources could be extended to other subgroups in an effort to attain similar success.
The trends related to individuals experiencing homelessness are alarming. The 2022 Point-in-Time Count reflected record highs in the history data collection. The overall subpopulation of individuals reached 421,392 people, surpassing the previous record that existed in 2007. The count of chronically homeless individuals also surpassed all previous years. These trends reflect a notable shift after a period of population declines.
Homelessness Trends: Race, Ethnicity, and Gender
In 2015, HUD began publishing homelessness data disaggregated by race, ethnicity, and certain gender categories. Although this isn’t a long history of data reporting, it overlaps with the recent period of rising homelessness.
Uneven progress is evident between 2015 and 2022 among various identity groups. The above chart (Subgroup Trends, 2007-2022) illustrates that some subgroups have increased in size, while others have simply stagnated or gotten smaller. For example, the trend lines for White people and Hispanics/Latinos have been moving upward.
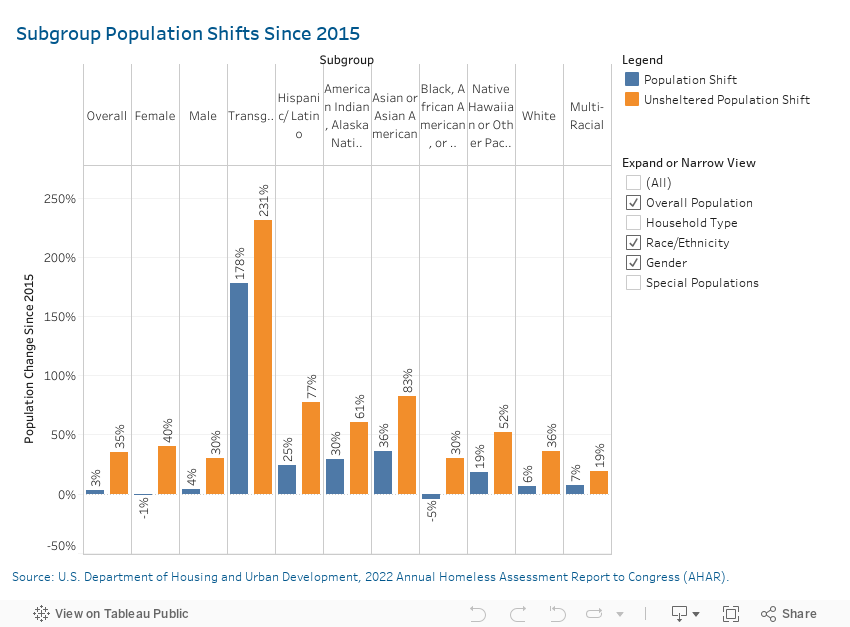
Digging a little deeper, the below chart (Subgroup Population Shifts Since 2015) highlights the extent of the changes occurring within each subgroup. It is clear that increases in homelessness have been particularly pronounced among people who are transgender (178 percent increase), Asian (36 percent increase), American Indian (30 percent increase), and Latino (25 percent increase).
Homelessness Trends: Shelter Utilization
Shelters are key components of America’s response to homelessness. Since the beginning of the COVID-19 pandemic, certain trends have emerged in relation to this form of temporary housing:
The impacts are not equal across groups. Since 2015, some populations have experienced growths in unsheltered homelessness that far surpass 35 percent. Of specific concern are people who are transgender (231 percent increase), Asian (83 percent increase), Latino (77 percent increase), and American Indian (61 percent increase). Challenges appear to be tied to western states (California, Oregon, Washington, and Hawaii) that are both diverse and highly immersed in affordable housing crises. Significant majorities of these homeless subgroup members live in these states.
Prior to this momentum, shelter bed numbers had been slowly trending downward as the number of permanent housing beds was greatly expanding. Such movements reflect fidelity to Housing First, a strategy that emphasizes stabilizing people in permanent housing as quickly possible.
Homeless Assistance in America: Use of Resources and Capacity
Homeless services systems often don’t have the resources to house everyone in need. Thus, they make a host of difficult decisions related to 1) who to help and 2) how to budget available funds among temporary shelter and permanent housing options. This section provides a window into how homeless service systems are currently making limited government investments work for a growing population of people experiencing homelessness.
Shelter Beds
As noted in the section above, the number of people living unsheltered has been on the rise since 2015. Systems may be responding to this trend by expanding shelter capacity: after a few years of decreasing the availability of shelter beds, they expanded the total number by 7 percent over the last four years.
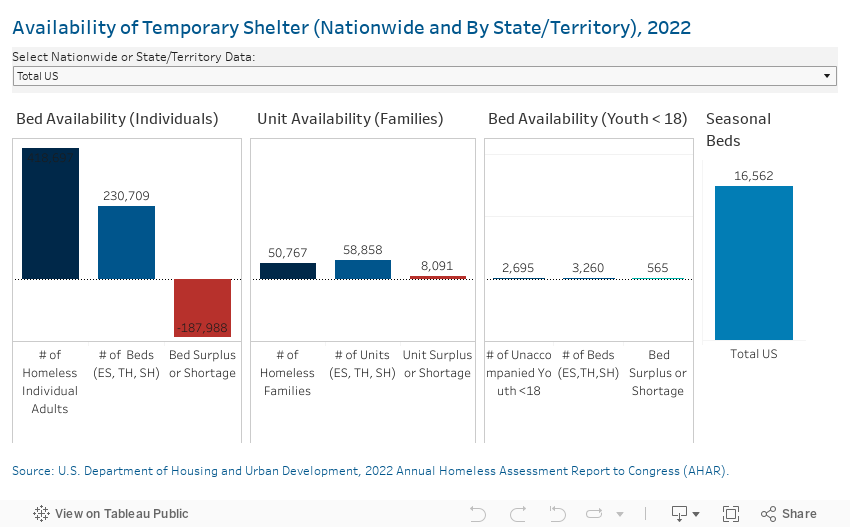
Importantly, a major contributor to unsheltered homelessness has been consistent and overwhelming shelter bed shortages since data collection began in 2007. At the high-water mark, there were 225,000 more people experiencing homelessness in America than existing shelter beds. Today, the gap has narrowed but remains vast, largely impacting individual adults.
In 2022, an examination of national-level data reveals a shortage of a little less than 188,00 year-round shelter beds for individual adults. There are only enough to reach 55 percent of the population. National-level data points to a surplus of available accommodations for families with children and unaccompanied youth.4
However, individual community circumstances vary. Thus, a specific town could have a shortage of available shelter units for families or a surplus of beds for individual adults.
Further, many communities set up temporary shelters during the winter months to prevent weather-related deaths. Thus, more people have spaces available to them than what is reflected by the year-round bed numbers.
Permanent Housing Beds
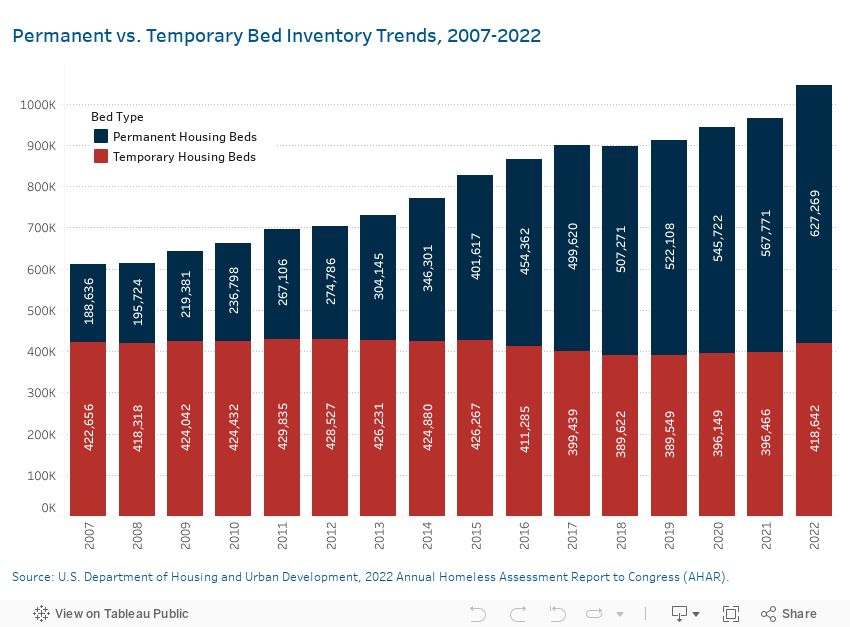
Homeless services system investments suggest a prioritization of permanent housing options over temporary shelter. This is in line with Housing First, an approach to ending homelessness that emphasizes stabilizing people in permanent housing as quickly as possible while also making services available.
Permanent housing makes up 60 percent of all beds connected to homeless services systems. The number of such slots has consistently trended upwards since data collection began, with a 26 percent growth over just the last five years. Despite these investments, homelessness (including unsheltered homelessness) is still on the rise. Available resources are simply not enough to ensure permanent housing for everyone who needs it.
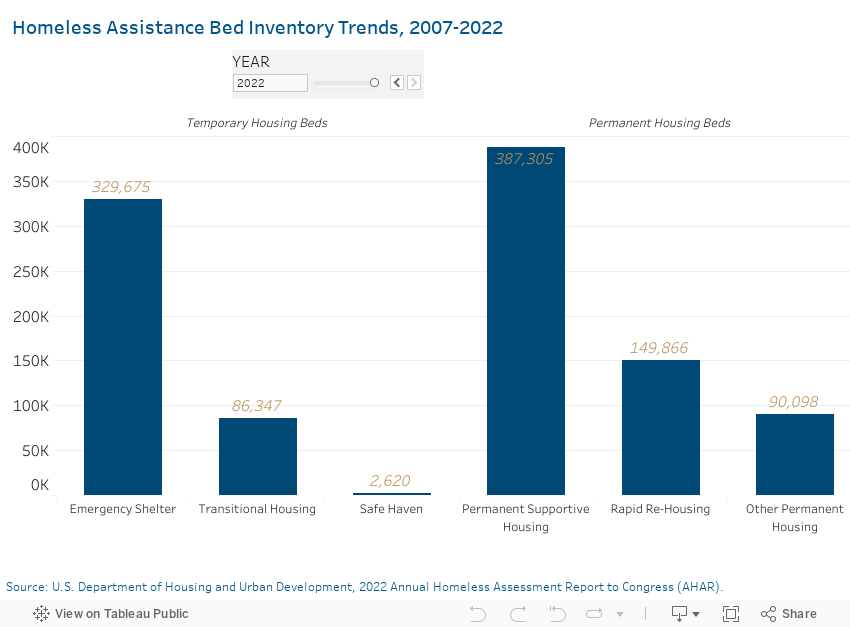
Common Forms of Assistance
The top two forms of housing assistance are permanent supportive housing (37 percent of system beds) and emergency shelter (32 percent of system beds). The third most popular form of assistance (Rapid Re-Housing) is also the fastest growing: the number of beds in this category has grown by 60 percent over the last five years. Transitional housing is the only category on the decline. This model requires people to meet certain benchmarks before being awarded with permanent housing, and has fallen out of favor given growing adherence to the Housing First strategy, which is backed by research evidence.
Indicators of Risk
In the lead up to the pandemic, the nationwide poverty rate had decreased for five consecutive years. In 2020, that streak ended and the number of people living in poverty increased by approximately 3.3 million people. This trend continued into 2021 when nearly 41.4 million people, or 12.8 percent of the U.S. population, were counted in this group. Certain racial groups have even higher rates of poverty, including Black people (21.8 percent), American Indian and Alaska Native people (21.4 percent), and Hispanics/Latinos (17.5 percent). People living in poverty struggle to afford necessities such as housing, food, and medical care.
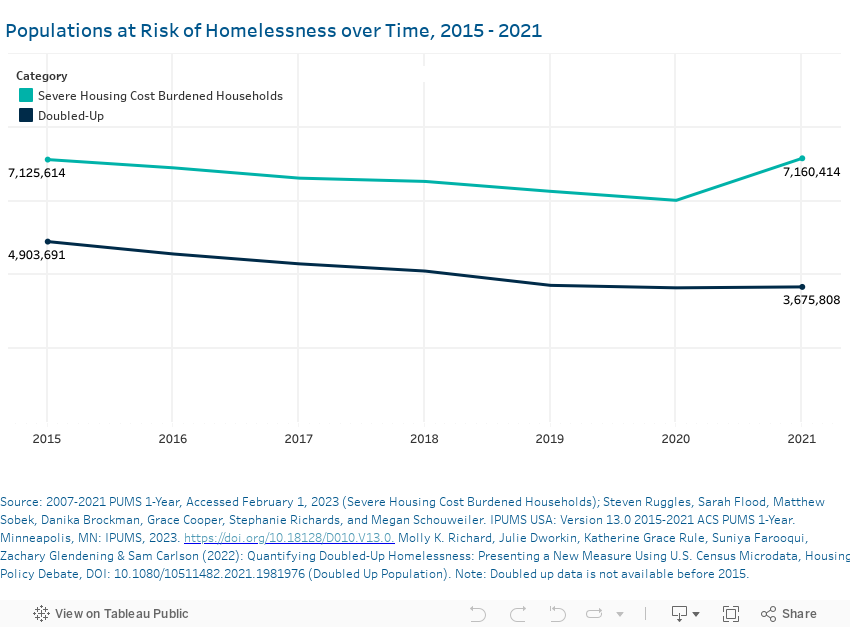
In 2021, an estimated 7.1 million American households experienced severe housing cost burden, which means that they spent more than 50 percent of their income on housing. The overall size of this group had been gradually decreasing since 2014, but rose again in 2021. The number of severely cost-burdened American households is now 25 percent higher than it was in 2007, the year the nation began monitoring homelessness data. And more troublesome patterns may exist for notable subpopulations, including people with the lowest incomes and female-headed households.
“Doubling up” (or sharing the housing of others for economic reasons) is another measure of housing hardship and risk of homelessness. Approximately 3.7 million people across the country were in these situations in 2021. Some doubled up individuals and families have fragile relationships with their hosts or face other challenges in the home, putting them at risk of literal homelessness. Similar to severely housing cost burdened households, the number of people living doubled up had been decreasing but ticked upwards again in 2021. Currently, the doubled up population is 25 percent smaller than it was in 2015, the year in which utilized data became available.5
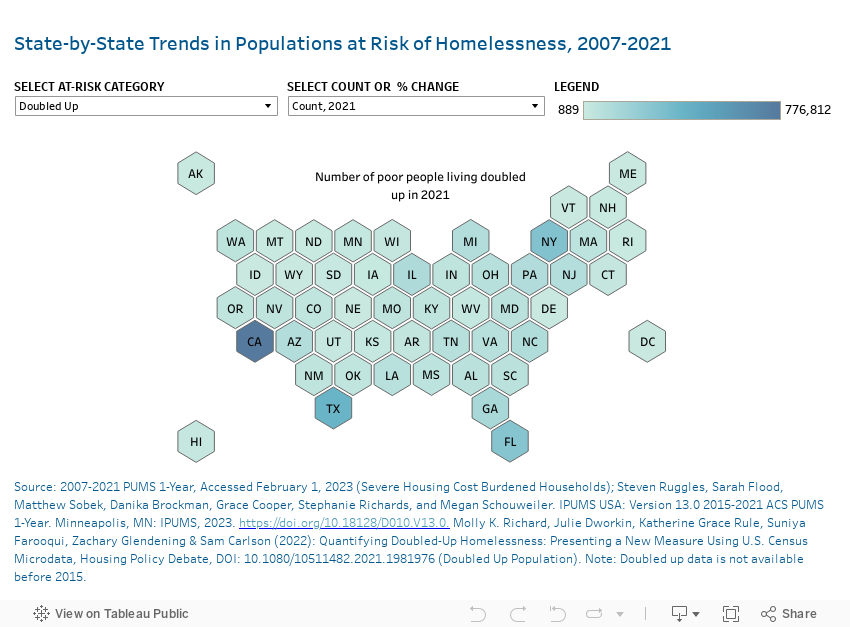
National data on households who are housing cost burdened and doubled up do not tell the whole story, as certain regions across the country face more dire challenges than can be seen for the U.S. as a whole. Severe housing cost burdened households grew at higher rates than the national average in several states and the District of Columbia. For example, since 2007, severe housing cost burdened households grew by 155 percent in Wyoming, 87 percent in Nevada, 72 percent in Maryland, and 65 percent in Hawaii. Similarly, from 2015 to 2021, the number of people doubled up increased by 59 percent in South Dakota and 36 percent in Maine.
For over a decade, the nation has not made any real progress in reducing the number of Americans at risk of literal homelessness. Despite decreasing trends in people living doubled up overall, the rise in severe housing cost numbers are concerning. Even more troubling are the risks that inflation rising to a 40-year high in 2022, expiring eviction moratoria, and fading Emergency Rental Assistance dollars pose to those at risk of experiencing homelessness.