


Race and ethnicity are dominant organizing factors in America. They impact where a person lives when they are born, how they die, and practically everything in between. Homelessness is no exception. This brief uses state and Continuum of Care (CoC) level data to gain greater insights into the intersections of race, ethnicity, and homelessness.
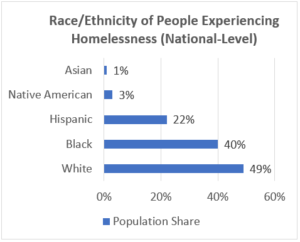
African Americans, Native Americans, and Hispanics/Latinxs are overrepresented among people experiencing homelessness at the national level and in various locations throughout the country. In other words, the percentage of each racial/ethnic group that is homeless is greater than its percentage of the overall population. These groups also have high rates of homelessness: that is, within each group, a high percentage of people is homeless.
The story is different for White and Asian Americans. Those groups are under-represented among people experiencing homelessness (the percentage of each that is homeless is smaller than its percentage of the overall population). And they both have relatively low rates of homelessness. Whites, however, are more likely to be unsheltered than other groups.
Representation
Federal measures related to poverty and hardship began to be collected in the 1950s and 1960s. Despite periods of progress, there are well-established patterns of racial disparity that can be seen across them. Black and Native Americans have disproportionately high adverse outcomes, and White Americans have disproportionately low ones. This pattern is reflected in the homelessness world.
Overrepresentation/Underrepresentation. Although a relatively small percentage of the national population (13 percent), Black people are homeless in all but two Continuums of Care (CoC). They are overrepresented in every state. There are only eight CoCs in which Black people are under- or equally represented, most of which have very small Black populations. The most significant exception is the Florence/Northwest Alabama CoC, where Black people are nine percent of both the general and homeless populations.
Although a small slice of the national population (1.3 percent), there are places in the country where Native Americans are a significant portion of the homeless population. In South Dakota, Alaska, New Mexico, Montana, North Dakota, Oklahoma, and Minnesota, Native Americans make up at least 10 percent of people experiencing homelessness. Certain CoCs within those states also have Native Americans significantly represented within their homeless counts.
White people experience homelessness in every CoC, and they are underrepresented in 93 percent of them. White Americans are underrepresented in the homeless counts of every state. They make up 76 percent of the general population but only 49 percent of the homeless population, nationally.
Asian Americans are generally underrepresented in the homeless population and are over-represented in only five CoCs. Hispanics/Latinxs are overrepresented nationally and across 40 percent of CoCs. However, the degree to which they are overrepresented tends to be dwarfed by African Americans.
Majority Representation. In some jurisdictions, a racial/ethnic group’s representation is large, so large that its members are the lion’s share of people experiencing homelessness. We examined states and CoCs where a singular group makes up more than 50 percent of the people experiencing homelessness.
Black people have majority status in 12 states and roughly a quarter of all CoCs. Although this is a relatively small number of places, the CoCs encompass the nation’s capital and other major cities such as Detroit, Atlanta, Memphis, Charlotte, St. Louis, Philadelphia, New York City, Chicago, Baltimore, Cleveland, Montgomery, Raleigh, New Orleans, Dallas, and Minneapolis.
Meanwhile, most people experiencing homelessness are White, and Whites are the majority of people experiencing homelessness in 32 states and a little over 60 percent of CoCs. However, in contrast to African Americans, these CoCs tend to be rural and suburban.
Other groups are rarely the majority of people experiencing homelessness within a jurisdiction. Native Americans are the majority in the state of South Dakota, which is also a singular CoC. Hispanics/Latinxs are the majority in only 4 CoCs outside of Puerto Rico.
Rates of Homelessness
Rates of homelessness offer another view of racial and ethnic disparities. This brief examines how many of each group is homeless per 10,000 people in the general population in a jurisdiction.
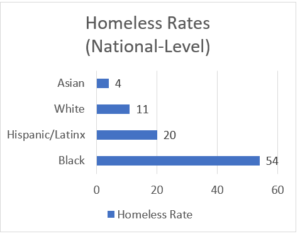
African Americans. Among the nation’s racial and ethnic groups, Black Americans have the highest rate of homelessness. Fifty-four out of every 10,000 Black people in the United States were homeless during the 2018 point-in-time count.
Although this number is large, there are states and CoCs with much higher rates. The highest rates are found in the northeast and west. For instance, New York is the state that is number one in Black homelessness (208 people per 10,000). Among CoCs, a subset in California have the highest Black homeless rates in the country:
| CoC | Black Homeless Rate per 10,000 People in the General Population |
| Watsonville/Santa Cruz City & County | 710 people |
| San Francisco | 591 people |
| Marin County | 346 people |
| Santa Rosa | 305 people |
| Salinas/Monterey, San Benito Counties | 286 people |
| Los Angeles City & County | 284 people |
These areas, like other parts of the northeast and west, have housing costs that are significantly higher than those in other parts of the country. Various researchers have found a link between increased housing costs and increased homelessness (See Glynn and Casey 2018; Quigley and Raphael 2001).
Massachusetts reflects a typical pattern of high housing costs, high homeless rates, and disproportionate racial and ethnic minority homelessness. According to the National Low Income Housing Coalition, the state has the third-highest housing wage (income level required to comfortably afford housing) in the country. Homelessness is elevated among all racial groups in the state, which has the 7th highest homeless rate in the country (29 per 10,000 people). Massachusetts is number one in the country in its rate of Hispanic/Latinx homelessness (107 per 10,000 people). Black people have the highest rate, however, with 125 people experiencing homelessness per 10,000 people in the general population.
Southern and midwestern states have lower rates of Black homelessness than other regions. Mississippi (6 per 10,000 people) has the lowest Black homelessness rate in the country. However, fitting a common pattern, other racial/ethnic groups within the state have even lower rates of homelessness—White Americans (4 per 10,000), Hispanics/Latinxs (5 per 10,000), and Asian Americans (4 per 10,000).
Hispanics/Latinxs. At the national level, 20 Hispanics/Latinxs experience homelessness out of every 10,000 people in the general population. This is higher than both the rate for Whites and the national overall average rate of homelessness. Hispanic/Latinx homelessness rates are particularly high in northeastern and western regions with high housing costs—fitting patterns that exist for all the racial groups discussed in this brief. And the rate of Hispanic/Latinx homelessness is particularly high. Outside of the northeast and western regions, Hispanic/Latinx homeless rates are unusually high in North Dakota (39 out of 10,000 people) and South Dakota (28 out of 10,000 people).
It should be noted that Hispanic and Latinx are ethnic categories which describe the places where an individual or the individuals’ parents or ancestors were born—either a Spanish-speaking nation or a nation in Latin America. People within these categories can be of any race (53 percent of Hispanics/Latinxs identify as White and 37 percent identify as “some other race”)(Humes, 2011). There is not information available on geographic origin or other subgroups within the Hispanic/Latinx population, which limits our understanding of homelessness among Hispanics/Latinxs.
Native Americans. There is not consistent general population data on Native Americans, and therefore this analysis was not able to examine rates of homelessness among that group at the state and CoC levels[1].
National-level data from the American Community Survey (ACS) and the decennial Census differ, but both instruments point to Native Americans having high rates of homelessness. ACS numbers place the group as having the highest rates in the country while the decennial Census suggest their rates are second only to Black Americans.
Other data also indicate challenges for Native Americans. In a recent survey of tribal housing officials, 88 percent said households in their areas experience homelessness—sleeping in emergency shelters, on the streets, or in other places not fit for human habitation (Biess, 2017). Although not all Native Americans live in tribal areas, for those that do, doubling up is also common. Between 3.6 and 7.2 percent are in such situations (HUD, Tribal Areas, 2017). Those living in urban areas are also at high risk of homelessness and doubling up (HUD, Urban Areas, 2017).
White Americans. White Americans have lower rates of homelessness. A national-level view reveals that 11 White people experience homelessness out of every 10,000 people in the general population. As with other groups, this figure masks variations at the local level.
Some CoCs have high rates of White homelessness. A handful has White rates that are even higher than 54, the concerning national-level rate for Black Americans (the entire list follows):
| CoC | White Homeless Rate per 10,000 People in the General Population |
| MA-502—Lynn | 177 people |
| FL-604—Monroe County | 128 people |
| CA-613—Imperial County | 111 people |
| CA-529—Lake County | 96 people |
| CA-509—Mendocino | 91 people |
| MA-508—Lowell County | 87 people |
| CA-506—Salinas/Monterey, San Benito counties | 77 people |
| MA-504–Springfield | 69 people |
| CA-508—Watsonville | 65 people |
| MA-500—Boston | 63 people |
| CA-501—San Francisco | 56 people |
These areas with extraordinarily high rates of White homelessness typically share another characteristic—even higher rates of homelessness among Black, Native American, and Hispanic/Latinx residents.
White homeless rates rarely surpass those of African Americans, Native Americans, and Hispanics/Latinxs. But this is the case in four CoCs: 1) FL-604 (Monroe County), 2) MA-502 (Lynn), 3) MI-513 (Marquette, Ager Counties), and 4) NY-520 (Franklin, Essex Counties).
As noted above, most Hispanics/Latinxs identify as White and are therefore included in this category. Some government instruments have a category for non-Hispanic/Latinx Whites. HUD’s Point-in-Time Count is not one of them. If available, such information would provide greater insights into White homelessness.
Asian Americans. At the national level, Asian Americans have the lowest rate of homelessness (4 out of every 10,000 people in the general population). And, compared to all other racial/ethnic groups, Asian Americans have the lowest rates of homelessness in 49 states and about 95 percent of CoCs.
Like Hispanics/Latinxs, data on the many and diverse subgroups of Asian Americans is unavailable. Thus, the Asian American story may be more complex with some subgroups having greater needs for assistance.
Individuals and People in Families
Among Whites, Native Americans, and Asian Americans, individual adults are clearly the majority of those experiencing homelessness. Families with children are only 23 to 25 percent of their group counts. For other racial and ethnic groups, the story is somewhat different. Far more people in families with children are represented within their homeless populations. Forty-three percent of Hispanics/Latinxs and 41 percent of African Americans experiencing homelessness are in families. For all groups, there are places in the country that are exceptions to the national picture.
The balance of individuals versus people in families within a jurisdiction impacts efforts to prevent and end homelessness. It influences the type of housing needed (single rooms, multiple bedrooms, or other) and the related costs of that housing. It further determines the kinds of services necessary and available to stabilize people experiencing homelessness. For example, school transportation, childcare, child welfare, and family-targeted income supports may be part of the unique needs of families with children.
Homeless Assistance
Much of this brief focuses on who becomes homeless, implicating societal factors external to homeless assistance systems. But what role, if any, do homeless service providers play in creating and maintaining inequality? Since providing shelter is one of the system’s primary functions, examining unsheltered rates might be one way to identify whether homeless systems contribute to racial or ethnic disparities.
Native Americans stand out. The group has the highest percentage of people living unsheltered: 50 percent. The reason(s) for this distinction should be explored.
Otherwise, typical patterns of inequality don’t seem to apply to unsheltered rates. Black Americans are not disproportionately harmed, being the group most likely to receive shelter services. Only 23 percent are unsheltered. And non-Hispanic/Latinx and Hispanic/Latinx unsheltered rates are practically equal, being 35 percent and 36 percent respectively.
Clearly, data other than unsheltered rates should be examined. Various actors are posing more in-depth questions to help evaluate inequities in homeless services. For example, the Alliance’s Racial Equality Network created a toolkit for state and local systems that asks them to consider if disparities exist in areas such as who gets into permanent housing and who returns to homelessness. Other areas that localities can examine to determine if race, ethnicity, stereotypes, and biases influence how assistance is delivered include:
- Shelter rules;
- Availability of social services;
- Decisions about where to locate shelters and services;
- Amount of effort and investment communities/states put into ending homelessness;
- Investment in the workforce serving people experiencing homelessness;
- Willingness of more advantaged groups to seek shelter and assistance from providers associated with helping disadvantaged groups;
- Overall dignity afforded to those experiencing homelessness by employees, neighbors, law enforcement, and others.
And, in turn, these factors can influence homeless program service delivery and individual outcomes. Considerations of such issues are growing amongst providers. However, far more data collection and research are needed to understand them fully.
About this Data
The data in this brief comes from HUD’s 2018 Point-in-Time Count. The information was self-reported by the consumer or based on observational data collected by a volunteer conducting surveys for the Count. The data may also have been extrapolated to estimate a total number of people experiencing homelessness in areas too large for a full street count.
Because CoCs report the data to HUD in aggregate, there are limitations on the ability to fully analyze the data at the intersections of identity. For example, the Alliance was unable to produce analysis that focused on White women or Native Americans over the age of 55.
The rate information partially relies on the Census Bureau’s Annual Community Survey (ACS) 5-year Estimates. This tool relies on sampling and offers subgroup population estimates. Although its sample size is relatively large, its reach is smaller than the decennial Census. It becomes less reliable with smaller groups and in areas with lower numbers of people. Notable, there is a significant gap between the number of Native Americans counted in the decennial Census and ACS, perhaps reflecting an undercount within the latter.
Despite these limitations, this data from HUD and the Census Bureau offer the most comprehensive country-wide data available on the various racial and ethnic groups experiencing homelessness. It can be a starting point for communities across the country to discuss how to improve assistance to vulnerable populations.
Works Cited
Biess, Jennifer. (2017). Homelessness in Indian Country is a Hidden, But Critical, Problem: Urban Institute.
DeWeaver, Norman. (2013). American Community Survey Data on the American Indian/Alaska Native Population: A Look Behind the Numbers: National Congress of American Indian Policy Research Center.
Glynn, Chris and Alexander Casey. (2018). Homelessness Rises Faster Where Rent Exceeds a Third of Income: Zillow Research.
Humes, Karen, Nicholas Jones, and Roberto Ramirez. (2011). Overview of Race and Hispanic Origin: 2010: U.S. Census Bureau.
National Low Income Housing Coalition. (2019). Out of Reach.
Quigley, John, and Steven Raphael. (2001). The Economics of Homelessness: The Evidence from North America: European Journal of Housing Policy, 1(3).
U.S. Department of Housing and Urban Development. (2017). Housing Needs of American Indians and Alaska Natives in Tribal Areas: A Report from the Assessment of American Indian, Alaska Native, and Native Hawaiian Housing Needs.
U.S. Department of Housing and Urban Development. (2017). Housing Needs of American Indians and Alaska Natives in Urban Areas: A Report from the Assessment of American Indian, Alaska Native, and Native Hawaiian Housing Needs
[1] The major sources of data on the population, the Census’ American Community Survey 5 Year Estimates and the decennial Census, differ greatly in their methods of assessment and in the numbers they collect for Native Americans, making state and local rate estimates unreliable for the racial group.
You might also be interested in


Stay Updated: Solutions, Stories, and Ways to Make an Impact
Sign up to receive updates on the Alliance’s work, including the latest research, advocacy efforts, and real stories of progress — plus ways you can help drive lasting change.