The community of professionals working to end homelessness regularly rely on two types of numbers to judge progress in reaching our goal. “Counts” and “rates” figure significantly into both the Alliance’s recently released State of Homelessness 2019 and HUD’s Annual Homeless Assessment Report. These data categories are clues to the state of homelessness at the federal, state, and local levels.
What exactly are they telling us?
Counts
A count is exactly what it sounds like: the total number of people in a region or category.
During the last week of January, communities across the country participate in HUD’s Point-in-Time count. Electronic records are used to generate a total number of people living in emergency shelters, transitional housing, and safe havens. Outreach workers canvas Continuum of Care areas to count the number of people sleeping on sidewalks, in parks, and other places not meant for human habitation. In 2018, communities counted 552,830 people experiencing homelessness.
Comparing the 2018 count to the previous year, the count from 5 years ago, or the the count from 2007 (the first year of the Point-in-Time Count) provides an indicator of progress. For example, in 2007 the count identified 647,258 people experiencing homelessness and in 2018 there were 552,830. This change in the overall counts points to progress being made in ending homelessness.
Beyond measuring progress over time, counts help to identify the regions experiencing the greatest challenges in ending homelessness.
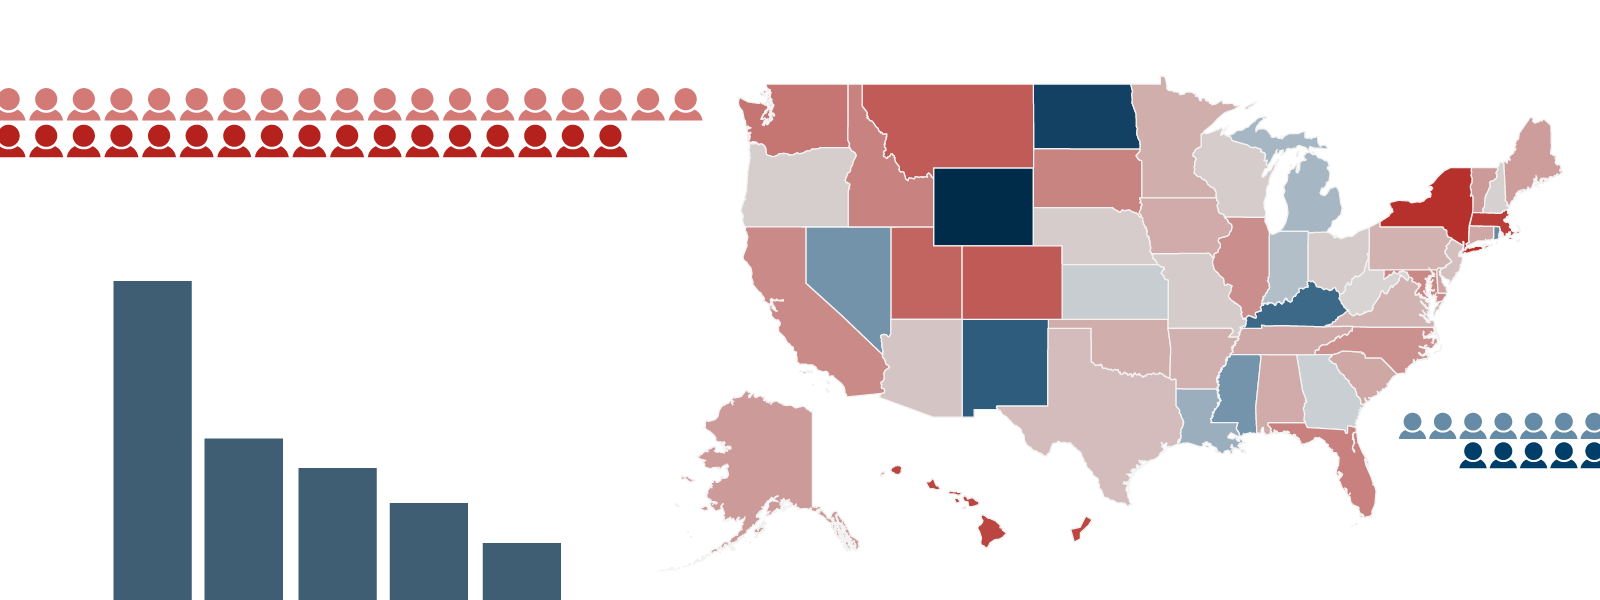
The ten states with the highest counts are California, New York, Florida, Texas, Washington, Massachusetts, Oregon, Pennsylvania, Colorado, and Illinois. Together, they account for 67 percent of the nation-wide homeless count. Thus, counts help in locating the epicenters of the homelessness crisis. Effective actions and policies in the states and CoCs with the highest counts would greatly advance the cause of ending homelessness.
The State of Homelessness 2019 includes visualizations/charts focused on homeless counts. They illustrate changes over time as well as the states and CoCs with the highest numbers of people experiencing homelessness.
Rates
Rates are another useful means of evaluating the state of homelessness. With this methodology, a homeless count is considered in relation to overall population. This simple calculation reveals the percentage (or share) of people experiencing homelessness in the nation, a state, or CoC.
In 2018, 17 people were experiencing homelessness out of every 10,000 people in the United States. This is the national rate of homelessness. How did we arrive at this number?
In 2018, the nation-wide homeless count was 552,830. And, according to the U.S. Census Bureau, the total population of the United States was 325,719,178. When the first number is divided by the second, the result is 0.001697, or 0.1697 out of every 100 people were experiencing homelessness.
Since those numbers seem abstract, the Alliance and HUD use a scale of 10,000 (instead of 100) and round to the nearest whole number.
Unlike counts, rates account for population shifts over time. For example, when a state’s homeless numbers increase over a five-year period, is it simply because the state is experiencing a general population explosion?
Ideally, as the years progress, rates should decrease. In 2014, the national rate of homelessness was 18 people out of every 10,000 compared to the current rate of 17 out of every 10,000.
Rates further allow for better comparisons across regions. California counted 129,972 people in its 2018 PIT. Hawaii reported a much smaller number—6,530 people. However, those two states have vastly different sizes in square mileage and populations. Is the difference in their counts solely due to the fact that one is large and one is small? Rate information answers that question. It reveals that Hawaii has 46 people experiencing homelessness out of every 10,000 while California only has 33. From this perspective, Hawaii is experiencing greater challenges than California.
Different Perspectives
Counts and rates are useful for different reasons. They both reflect the state of homelessness and the progress the nation is making towards ending this national crisis, but they provide different context for evaluating progress.
For more information on rates and counts in your region, please consult the Alliance’s State of Homelessness report. The Alliance’s Homeless Research Institute is constantly working to improve this annual product. If you have ideas/thoughts to contribute to this process, please let us know through this online survey.