


The Demographic Data Project compiles data analyzed from the U.S. Department of Housing and Urban Development (HUD) 2018 Point-in-Time Count to examine the rates of homelessness among different populations. This series works to promote equity, by examining data that illustrates different experiences of homelessness based on gender identity, race, and region.
Gender Minorities
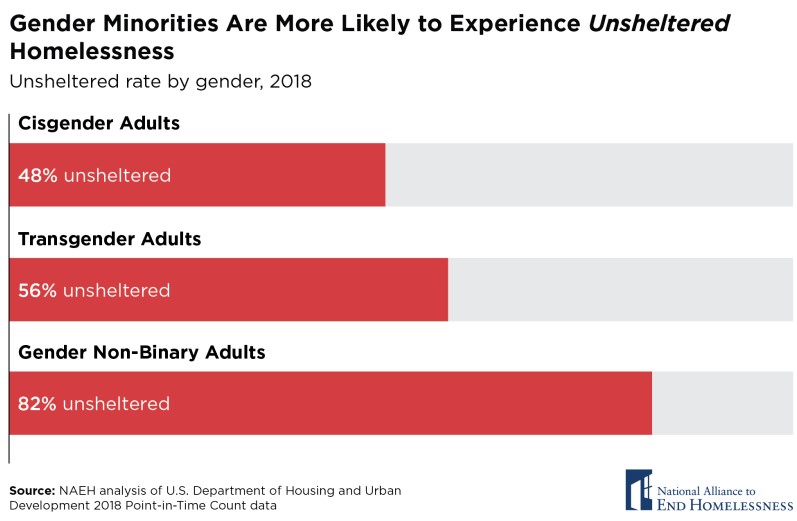
During the 2018 Point-in-Time (PIT) Count, transgender and gender non-binary individuals were counted in almost every state and nearly two-thirds of the Continuums of Care (CoCs) in the country. Analysis from this data reveals that both groups are more likely to be unsheltered than cisgender adults.
READ MORE
Read the brief:
The first brief in the Demographic Data Project tells the data stories of transgender and non-binary people in the homeless services system. The analysis points to the increased vulnerability that these groups experience, and points to an urgent need for providers in every state and CoC to ensure equal access to services.
Interactive Data:
Gender Minority Homelessness (Tableau)
Additional Data:
Data Snapshot: Homelessness Among Gender Minorities
Relevant Blogs:
Using Data to Promote Equity: The Demographic Data Project
How to Make Shelter Safe for Transgender Individuals
Gender and Individual Homelessness
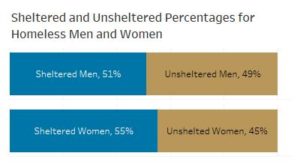
Although men are the overwhelming majority of individuals counted in HUD’s annual Point-in-Time Count, and are also more likely than women to be unsheltered, the gender dynamics of homelessness require deeper examination. The second installment of the Demographic Data Project exposes counted gender disparities among the individual homeless population.
READ MORE
Read the brief:
The second brief in the Demographic Data Project analyzes population and unsheltered data through the lens of gender, offering a fuller understanding of male and female homelessness. The 2018 Point-in-Time (PIT) Count shows that men are far more likely to experience homelessness, and are far more likely to experience unsheltered homelessness than women. This analysis dives deeper into these disparities, and other data regarding gender and homelessness.
Interactive Data:
Gender Minority Homelessness (Tableau)
Race and Ethnicity
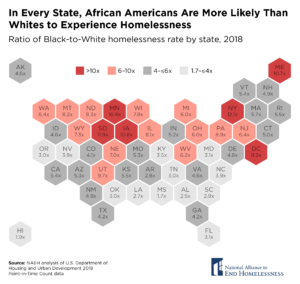
Race and ethnicity are dominant organizing factors in America. They impact where a person lives when they are born, how they die, and practically everything in between. Homelessness is no exception. The latest installment of the Demographic Data Project uses state and Continuum of Care (CoC) level data to gain greater insights into the intersections of race, ethnicity, and homelessness.
READ MORE
Read the brief:
The third installment of the Alliance’s Demographic Data Project highlights racial disparities among people experiencing homelessness. Data gathered from the 2018 Point-In-Time Count lends a deeper analysis to disproportionate racial representation in homeless populations.
Interactive Data:
Racial Disparities in Homelessness (Tableau)
Additional Data:
Data Snapshot: Racial Disparities in Homelessness
Relevant Blogs:
Using Data to Promote Equity: The Demographic Data Project
How to Make Shelter Safe for Transgender Individuals
The Role of Geography
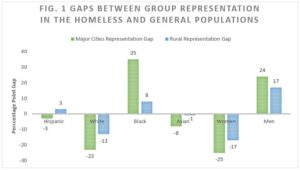
The fourth and final installment in the Demographic Data Project analyzes how representation within homeless populations across the United States differs by geographic region, including major cities, smaller cities, suburbs, and rural areas.
READ MORE
Read the brief:
Only 25 percent of Americans live in major cities, but 50 percent of people experiencing homelessness are in these areas. This is true across all the racial, ethnic and gender groupings. In contrast, the percentage of residents experiencing homelessness is rural areas is small when compared to other geographic categories—in other words, the rate of homelessness is low. This brief explores the varying rates of homelessness among differing demographics dependent on location.
Interactive Data:
Data Visualization: Homeless Population Representation by Location
You might also be interested in

Stay Updated: Solutions, Stories, and Ways to Make an Impact
Sign up to receive updates on the Alliance’s work, including the latest research, advocacy efforts, and real stories of progress — plus ways you can help drive lasting change.